HAllA integration outputs
This page describes the integration outputs generated by MTD Explorer using HAllA.
HAllA is used to identify associations between two high-dimensional data layers.
In MTD Explorer, this step helps explore relationships between host-derived features and microbiome or functional profiles.
The main folder is:
Documentation example dataset
Figures shown on this page were generated from public Biomphalaria glabrata
RNA-seq data from NCBI BioProject
PRJNA1306560.
The example run contains infected, infection_failed, and uninfected
groups. Pairwise comparison examples use infected_vs_uninfected where
applicable. See Example dataset: Biomphalaria glabrata (PRJNA1306560) for the dataset origin, experimental groups, SRA accessions, and interpretation notes.
Main figures
The representative HAllA integration figures shown on this page are:
These figures summarize different views of the host-microbiome integration analysis.
Top HAllA associations
The main Hallagram figure shown here is:
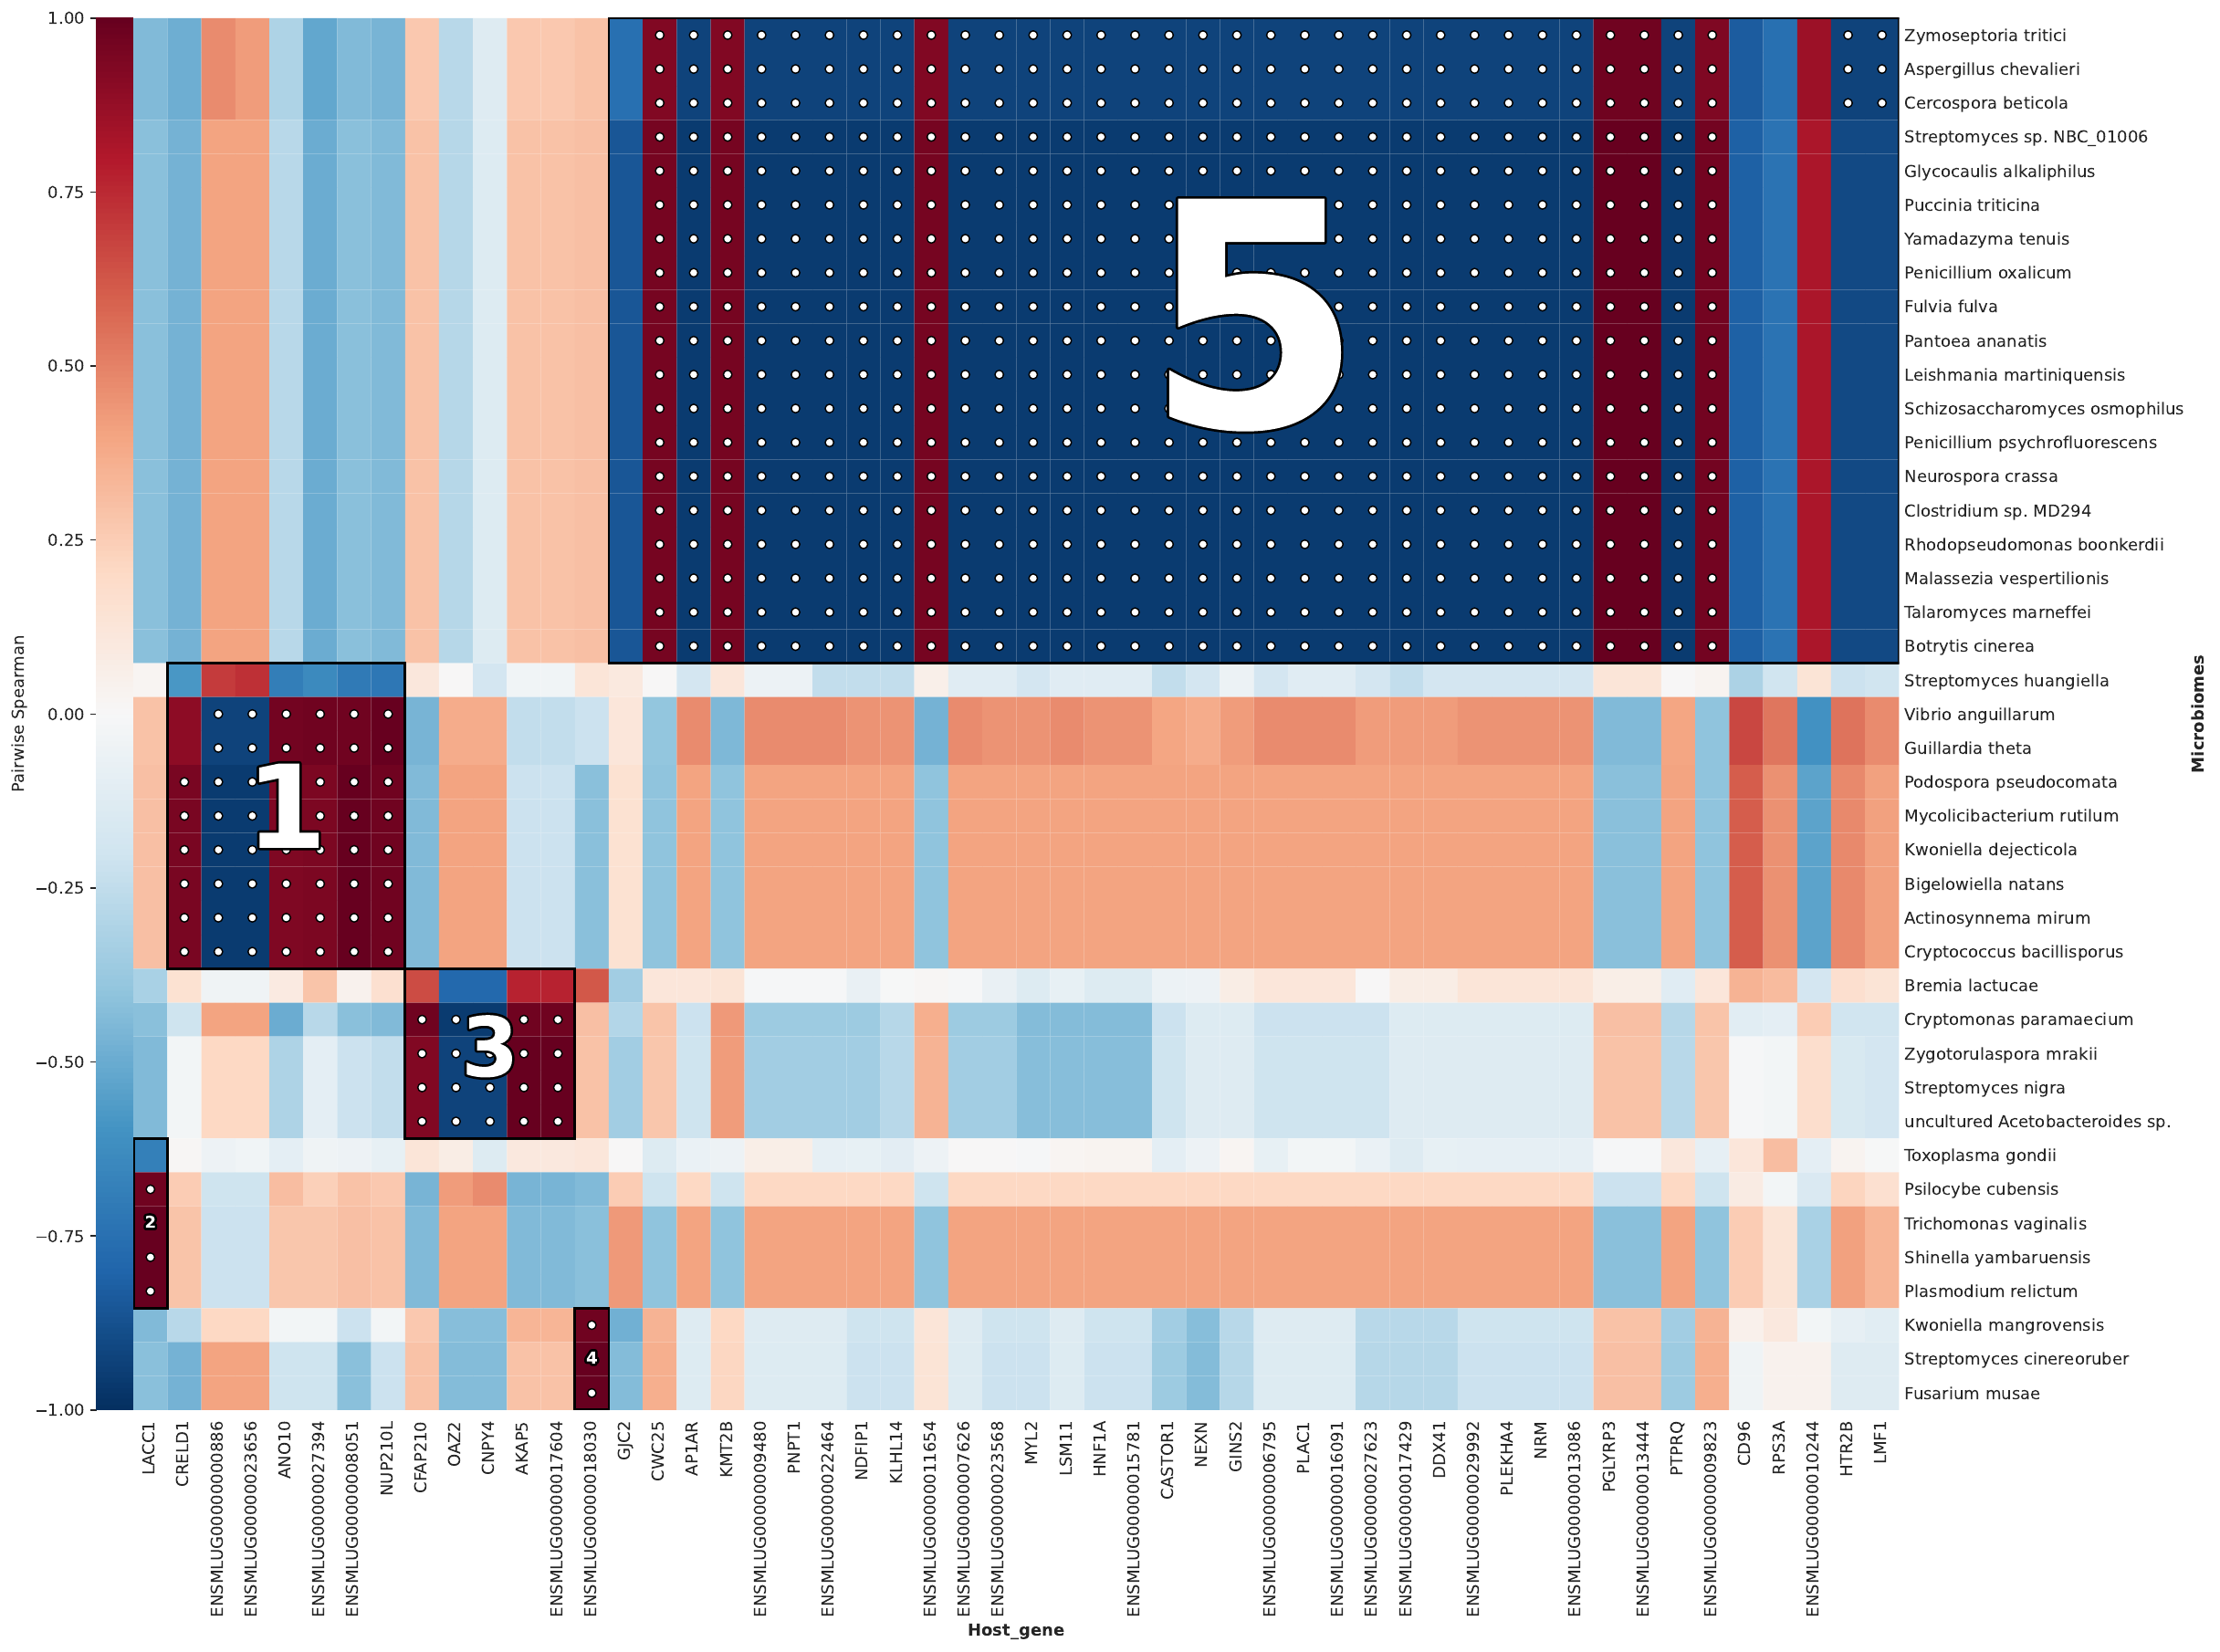
This figure summarizes the top association patterns detected by HAllA.
The Top5 suffix records the requested display tier. If fewer than five
significant HAllA clusters are available, MTD Explorer uses all available
significant clusters. Higher requested tiers that would reproduce the same
effective selection are skipped rather than generating duplicate figures.
It is useful for quickly identifying candidate relationships between host features and non-host or functional features.
The figure should be treated as an exploratory association view.
It does not prove causality.
K-means summary
The k-means summary figure is usually:
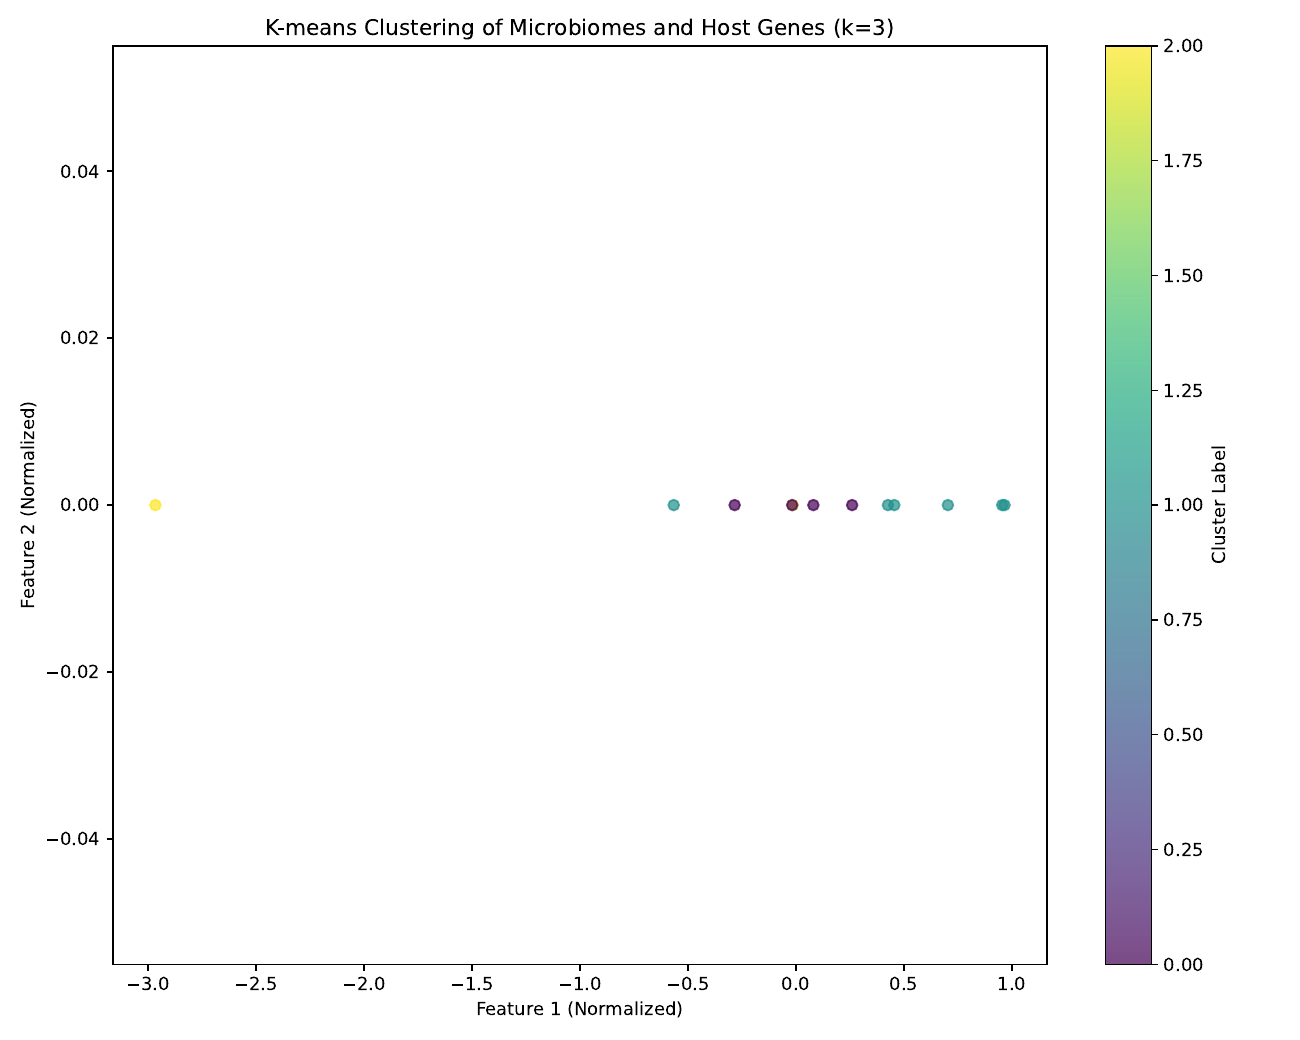
This figure provides a clustering-oriented summary of the integrated feature space.
It can help users inspect whether samples or features form recognizable groups after integration.
Use this output as an exploratory visualization, not as a standalone statistical test.
PLS-DA summary
The PLS-DA summary figure is usually:
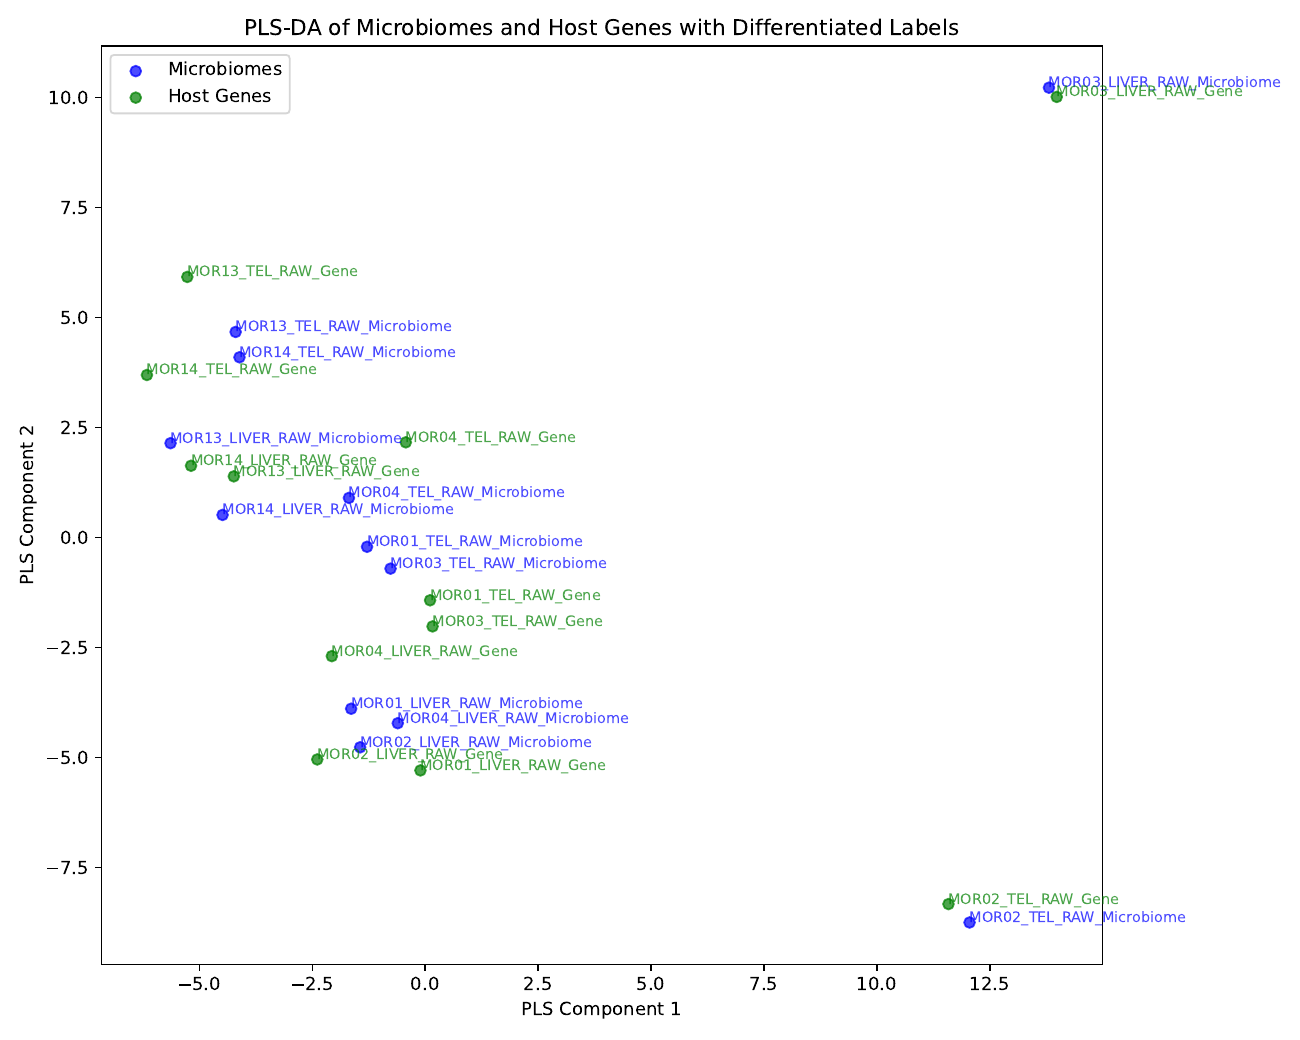
This figure provides a supervised multivariate view of group separation.
It is useful for visual inspection of how integrated features relate to the sample groups defined in the analysis.
PLS-DA results should be interpreted carefully, especially with small sample sizes.
Recommended inspection order
For HAllA integration outputs, inspect:
halla/host_gene/hallagram_Top5.pdf
halla/kmeans_results.pdf
halla/pls_da_results.pdf
halla/
methods/mtd_methods_run_parameters.csv
The methods/mtd_methods_run_parameters.csv file records run settings and
software versions.
What these outputs can support
HAllA integration outputs can help identify candidate associations between host expression or host gene-set activity and microbiome or functional features.
They can also help prioritize feature pairs for biological interpretation.
What not to conclude
Do not interpret HAllA associations as causal relationships.
Do not interpret visual separation in k-means or PLS-DA plots as proof of a biological mechanism.
Do not interpret a top association without checking the underlying feature tables, sample metadata, group labels, and study design.
When outputs may be missing
HAllA outputs may be missing when one of the input matrices is unavailable, when too few samples are available, when the matrices do not share matching sample names, or when the association step fails but earlier pipeline steps finish successfully.