Functional profiling outputs
This page describes the functional profiling outputs generated by MTD Explorer.
Functional profiling summarizes non-host gene-family profiles derived from HUMAnN and regrouped into Gene Ontology and KEGG annotations.
The main folder is:
When --hpc-conf FILE is supplied, the per-sample MetaPhlAn and
HUMAnN profiling work can be submitted through the optional
Slurm HPC backend. The scientific result paths described on
this page remain the same; the HPC backend changes where and how eligible
per-sample work is executed, while omitting --hpc-conf keeps the normal local
execution path.
Documentation example dataset
Figures shown on this page were generated from public Biomphalaria glabrata
RNA-seq data from NCBI BioProject
PRJNA1306560.
The example run contains infected, infection_failed, and uninfected
groups. Pairwise comparison examples use infected_vs_uninfected where
applicable. See Example dataset: Biomphalaria glabrata (PRJNA1306560) for the dataset origin, experimental groups, SRA accessions, and interpretation notes.
Main folders
The functional outputs are usually split into two annotation layers:
hmn_genefamily_abundance_files/Nonhost_hmn_DEG/GO/
hmn_genefamily_abundance_files/Nonhost_hmn_DEG/KEGG/
The GO/ folder contains Gene Ontology functional profiles.
The KEGG/ folder contains KEGG functional profiles.
GO functional heatmap
The compact GO heatmap is usually stored as:
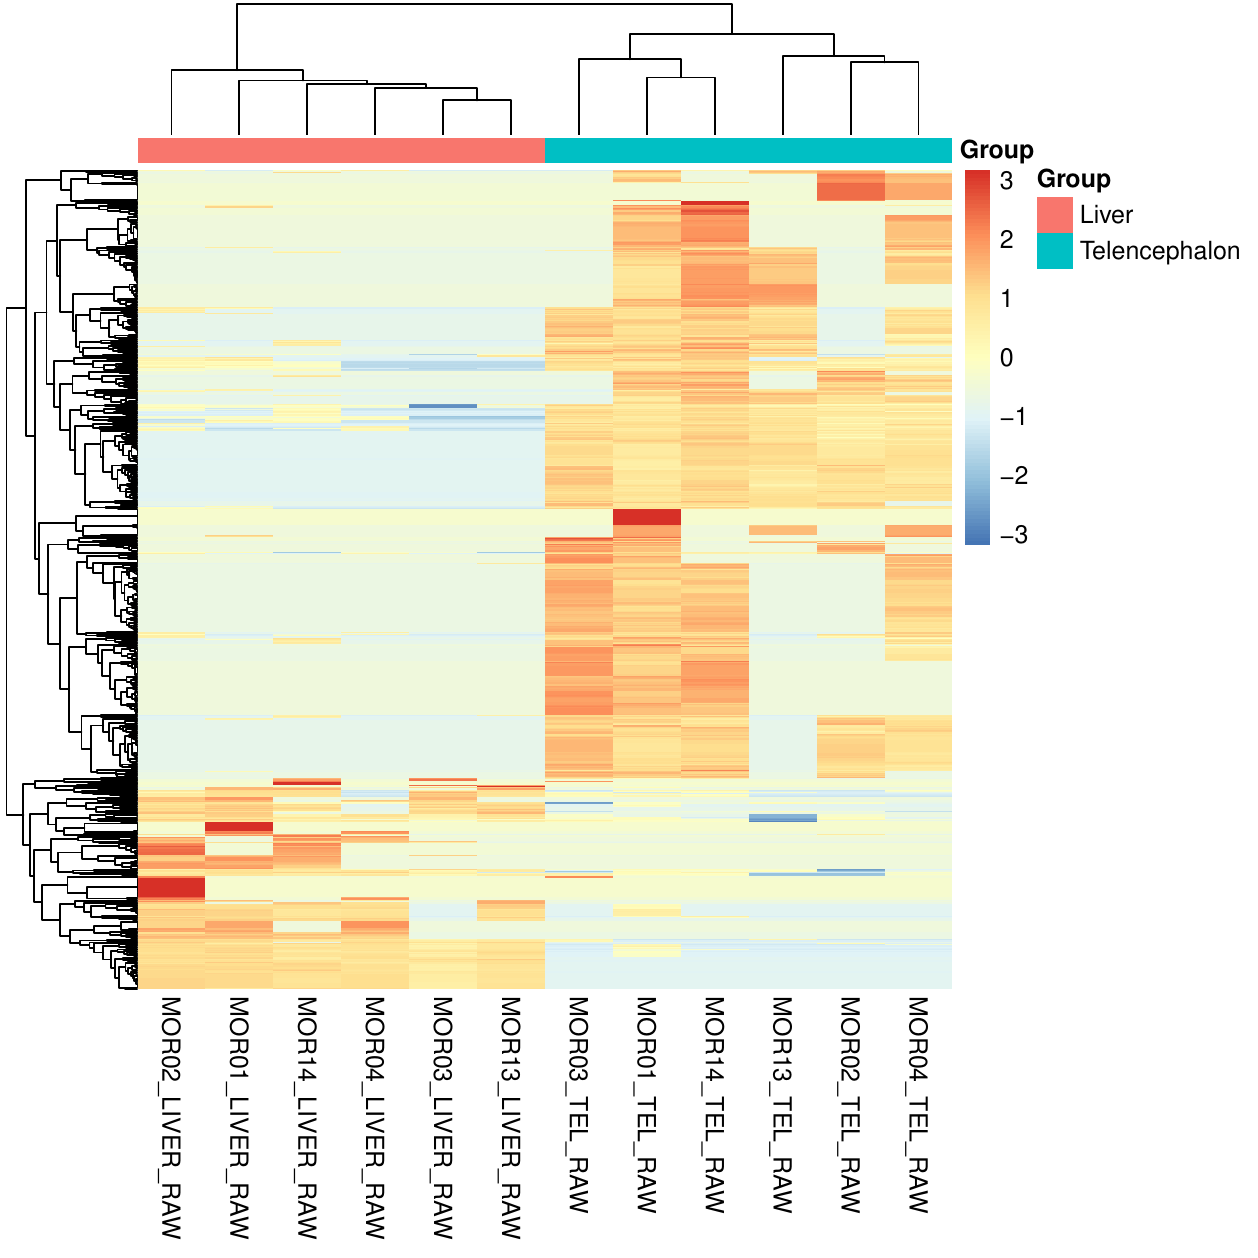
This heatmap summarizes GO-level functional abundance patterns across samples.
It is useful for checking whether samples cluster by biological group and whether a subset of GO terms dominates the functional signal.
The full heatmap may also be available as:
GO functional PCA
The group-colored GO PCA is usually stored as:
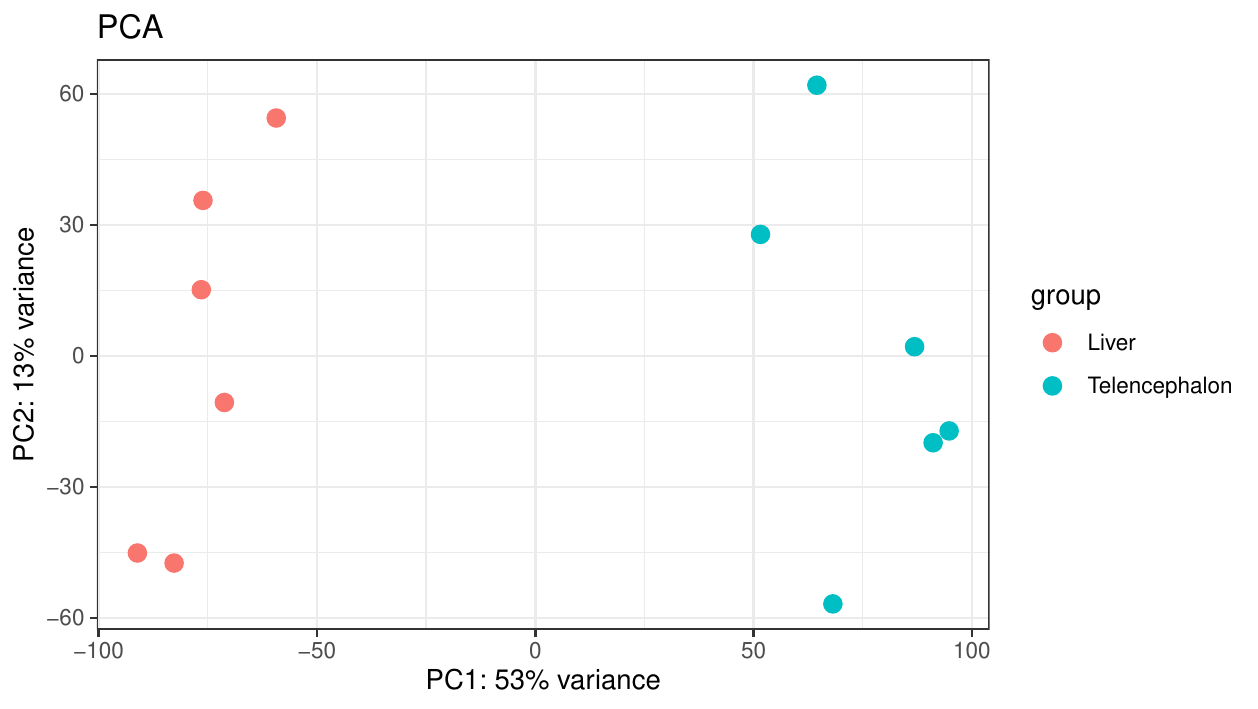
This PCA summarizes global variation in GO-level functional profiles.
Samples that cluster close together have more similar GO functional profiles.
Other PCA versions may also be present:
hmn_genefamily_abundance_files/Nonhost_hmn_DEG/GO/PCA.pdf
hmn_genefamily_abundance_files/Nonhost_hmn_DEG/GO/PCA_label.pdf
hmn_genefamily_abundance_files/Nonhost_hmn_DEG/GO/PCA_label_color.pdf
KEGG functional heatmap
The compact KEGG heatmap is usually stored as:
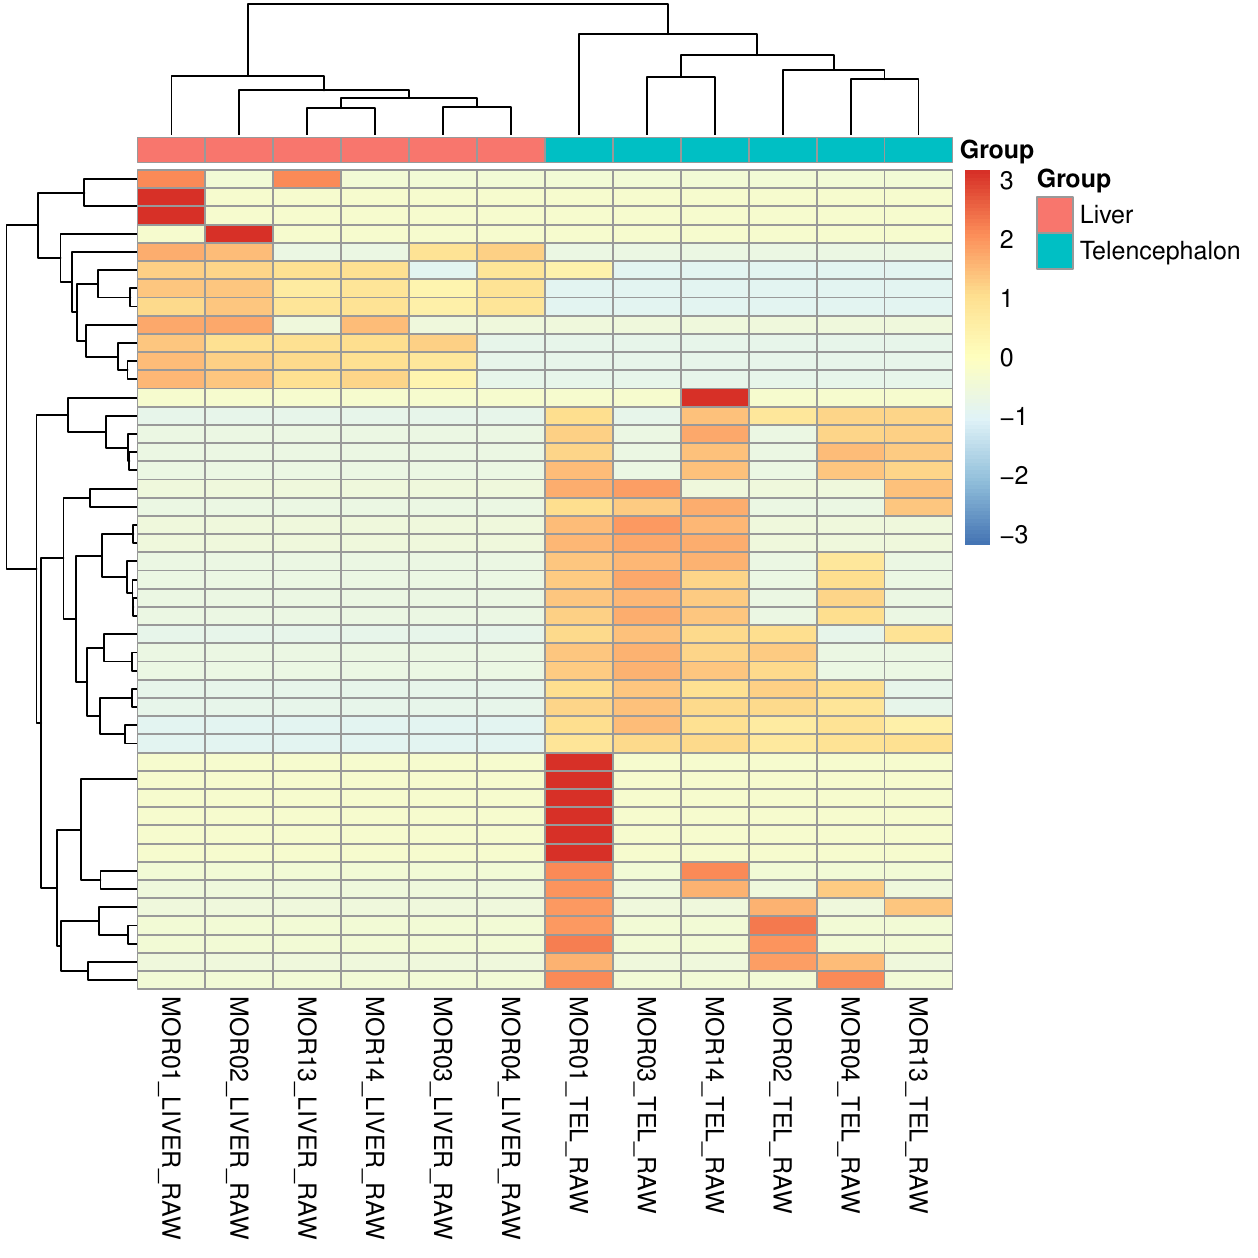
This heatmap summarizes KEGG-level functional abundance patterns across samples.
It provides a pathway-oriented view of the non-host functional profile.
The full heatmap may also be available as:
KEGG functional PCA
The group-colored KEGG PCA is usually stored as:
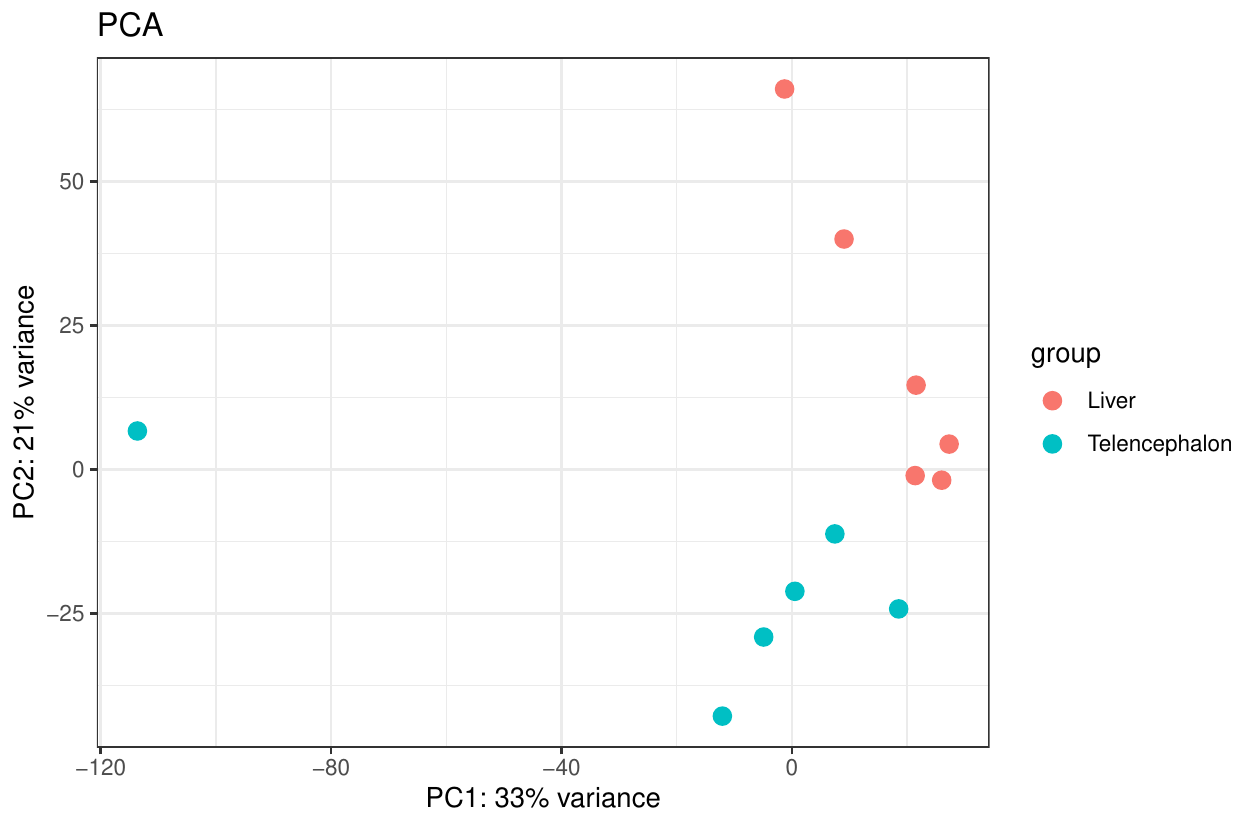
This PCA summarizes global variation in KEGG-level functional profiles.
It is useful for checking whether pathway-level profiles separate according to the groups defined in the samplesheet.
Other PCA versions may also be present:
hmn_genefamily_abundance_files/Nonhost_hmn_DEG/KEGG/PCA.pdf
hmn_genefamily_abundance_files/Nonhost_hmn_DEG/KEGG/PCA_label.pdf
hmn_genefamily_abundance_files/Nonhost_hmn_DEG/KEGG/PCA_label_color.pdf
Differential functional outputs
Comparison-specific functional outputs may be stored in folders such as:
hmn_genefamily_abundance_files/Nonhost_hmn_DEG/GO/infected_vs_uninfected/
hmn_genefamily_abundance_files/Nonhost_hmn_DEG/KEGG/infected_vs_uninfected/
These folders may contain:
The standard volcano plots are not shown on this page because they can be visually dense. Use the comparison-specific tables as the primary source for statistical interpretation.
MaAsLin2 outputs
Some functional runs may also contain MaAsLin2 outputs:
hmn_genefamily_abundance_files/Nonhost_hmn_DEG/GO/MaAsLin2_results/
hmn_genefamily_abundance_files/Nonhost_hmn_DEG/KEGG/MaAsLin2_results/
Typical files include:
These files are useful for multivariable functional association analyses.
Recommended inspection order
For functional profiling outputs, inspect:
hmn_genefamily_abundance_files/
hmn_genefamily_abundance_files/Nonhost_hmn_DEG/GO/heatmap_thumbnail.pdf
hmn_genefamily_abundance_files/Nonhost_hmn_DEG/GO/PCA_color.pdf
hmn_genefamily_abundance_files/Nonhost_hmn_DEG/KEGG/heatmap_thumbnail.pdf
hmn_genefamily_abundance_files/Nonhost_hmn_DEG/KEGG/PCA_color.pdf
methods/mtd_methods_run_parameters.csv
Interpretation notes
Functional profiling outputs can help show whether GO-level or KEGG-level profiles cluster by group.
They can also highlight broad functional differences between sample groups.
Do not interpret PCA separation alone as proof of functional differential abundance.
Do not interpret heatmap clustering without checking metadata, abundance tables, taxonomic results, read depth, and database settings.
When outputs may be missing
Functional profiling outputs may be missing when HUMAnN did not produce usable gene-family profiles, GO or KEGG regrouping failed, translated tables were not generated, too few samples were available, or the abundance matrix was too sparse.